Deploy then Monitor
Last time we’ve deployed the WVD solution into production.
Now it is to get some insight and monitoring.
I’ll assume you already have configured:
- WVD solution
- Azure Insights
- Azure Log Analytics workspace - where you gather all your logs (you do it, right?
 )
)
Management tool from Azure
You can install native diagnostics management tool. This docs explain how-to.
Azure App Insight
Instead, we have decided to go with Azure Application Insights (for VMs) and logging of WVD actions to Azure Log Analytics.
Configure App Insight
Go to your VM and in Monitoring section select Insights:
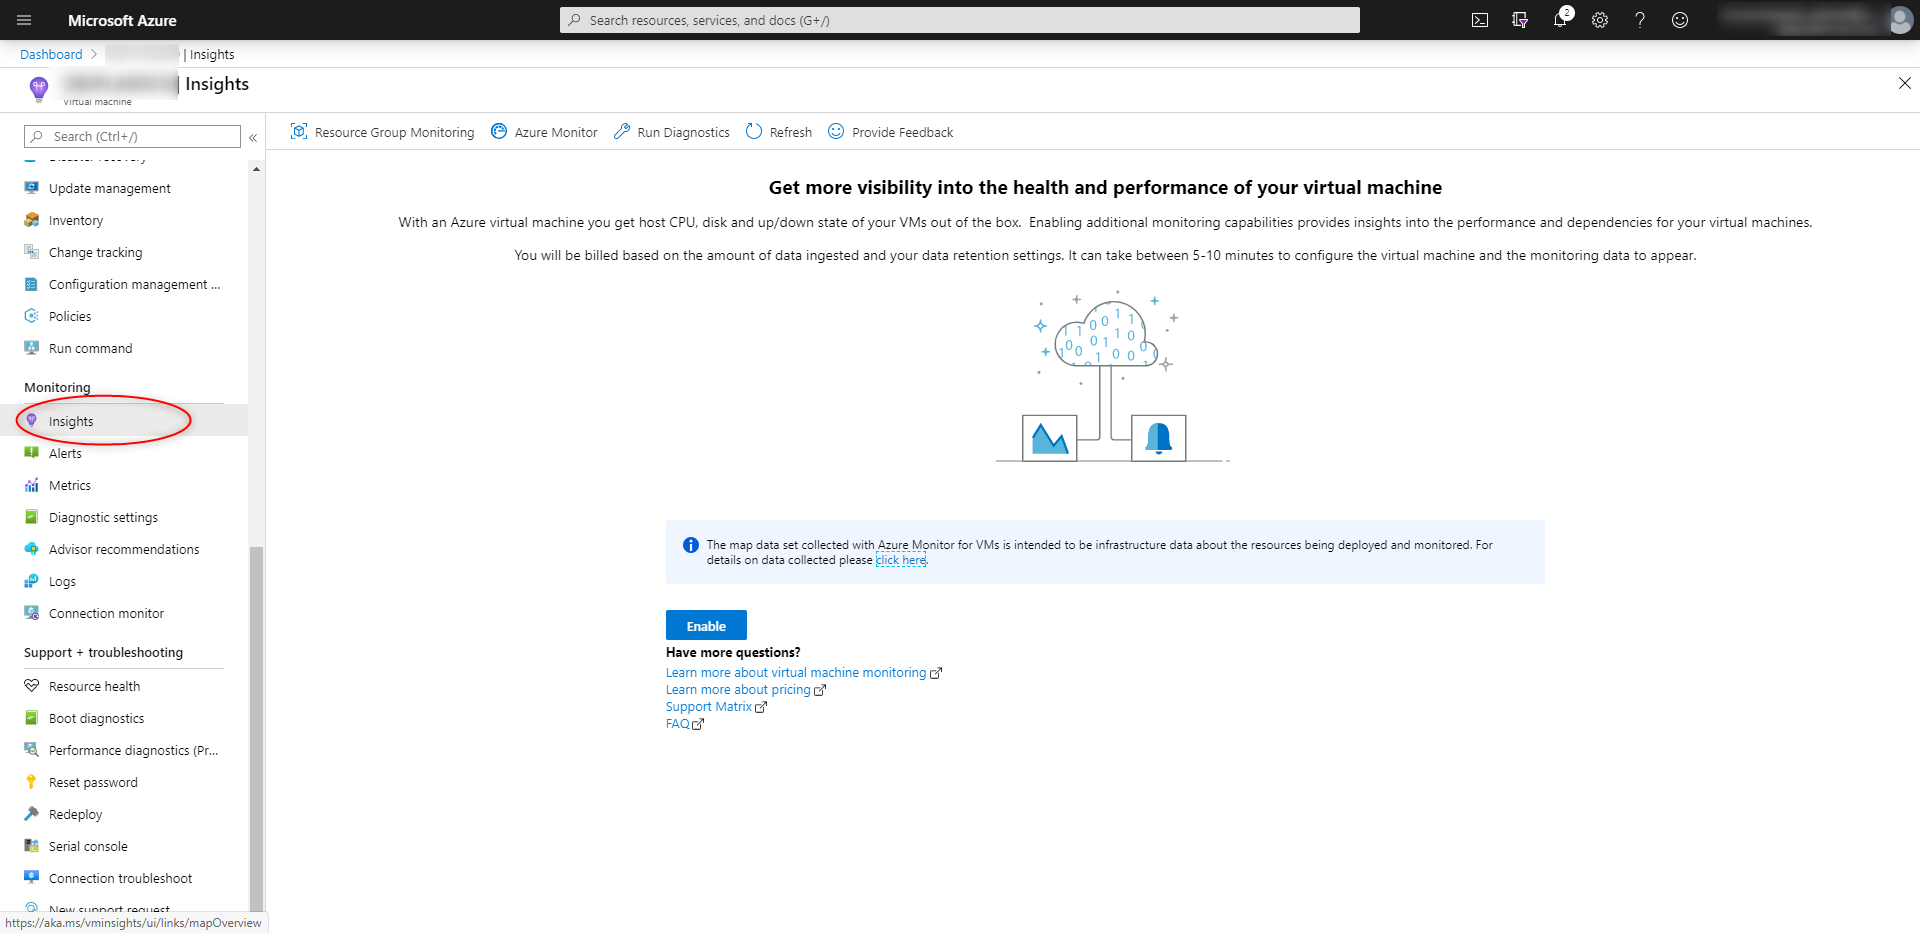
Then the big Enable button in the middle:
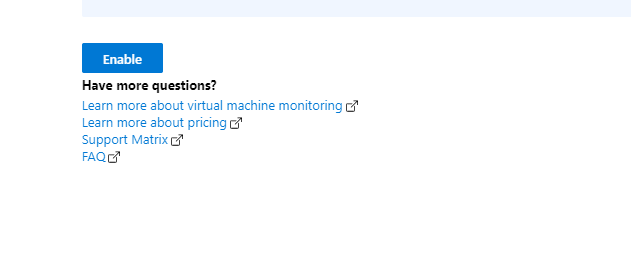
And you’re done ![]()
Monitor with App Insight
Once you configure App Insight for your VMs, go to Insights of one of those VMs. Then change scope to ResourceGroup:
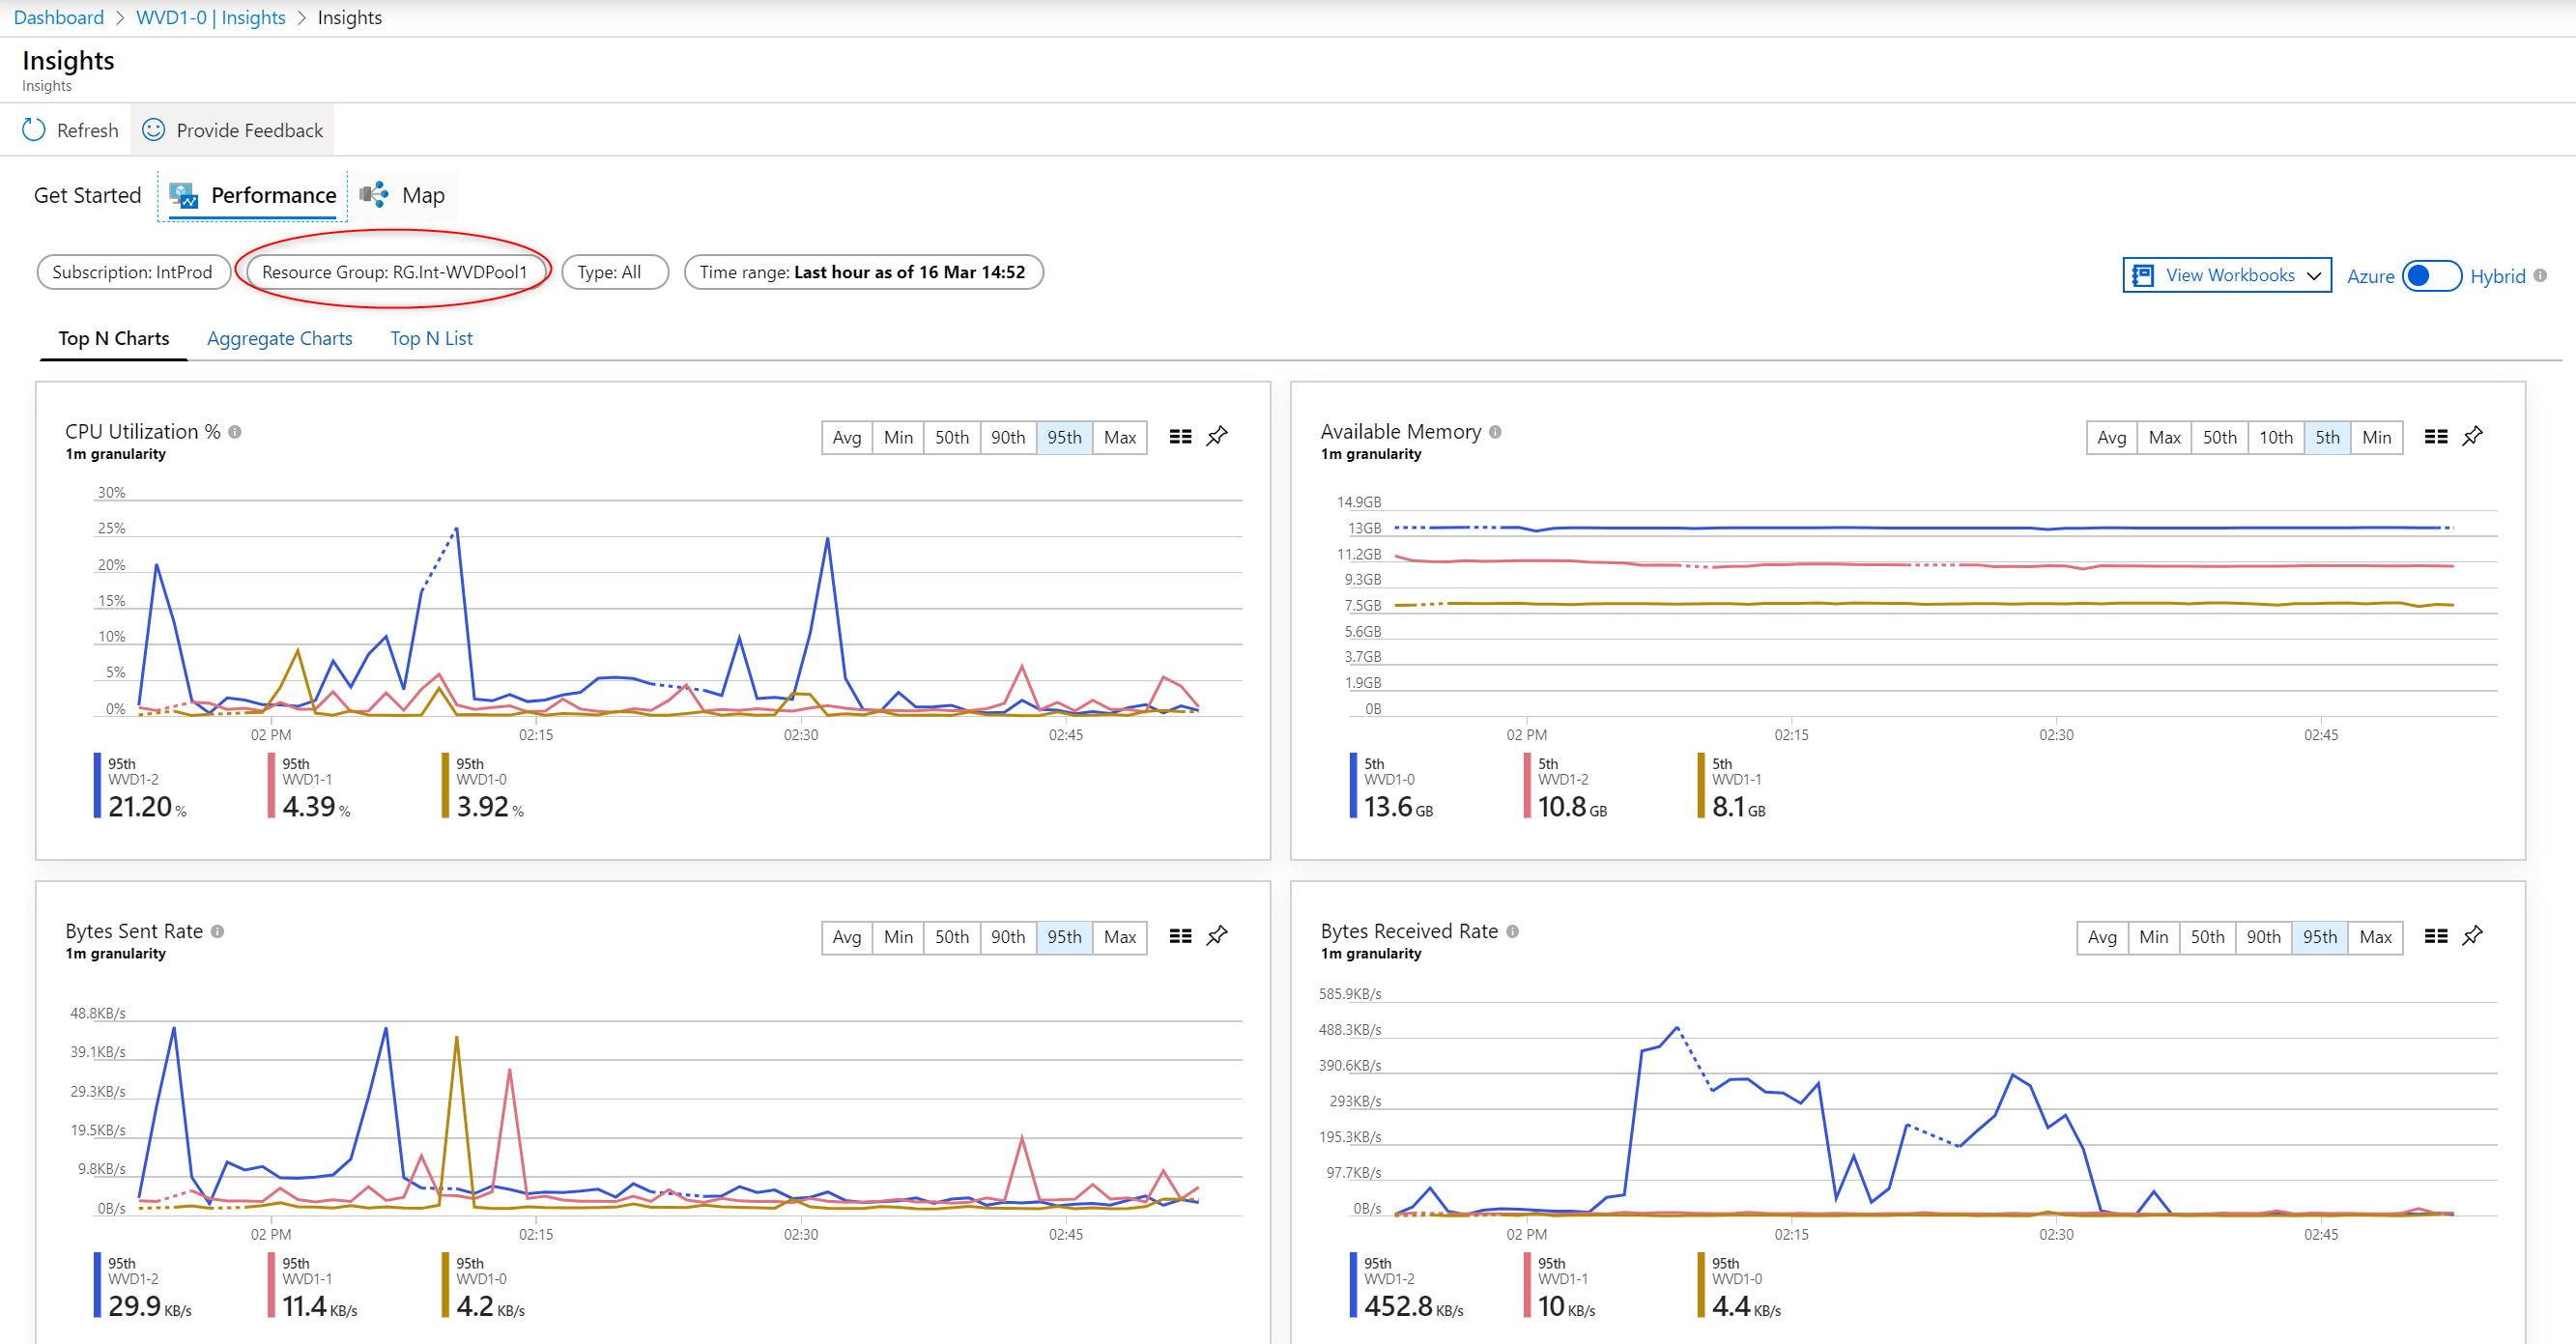
Now you have basic stats of each of your hosts.
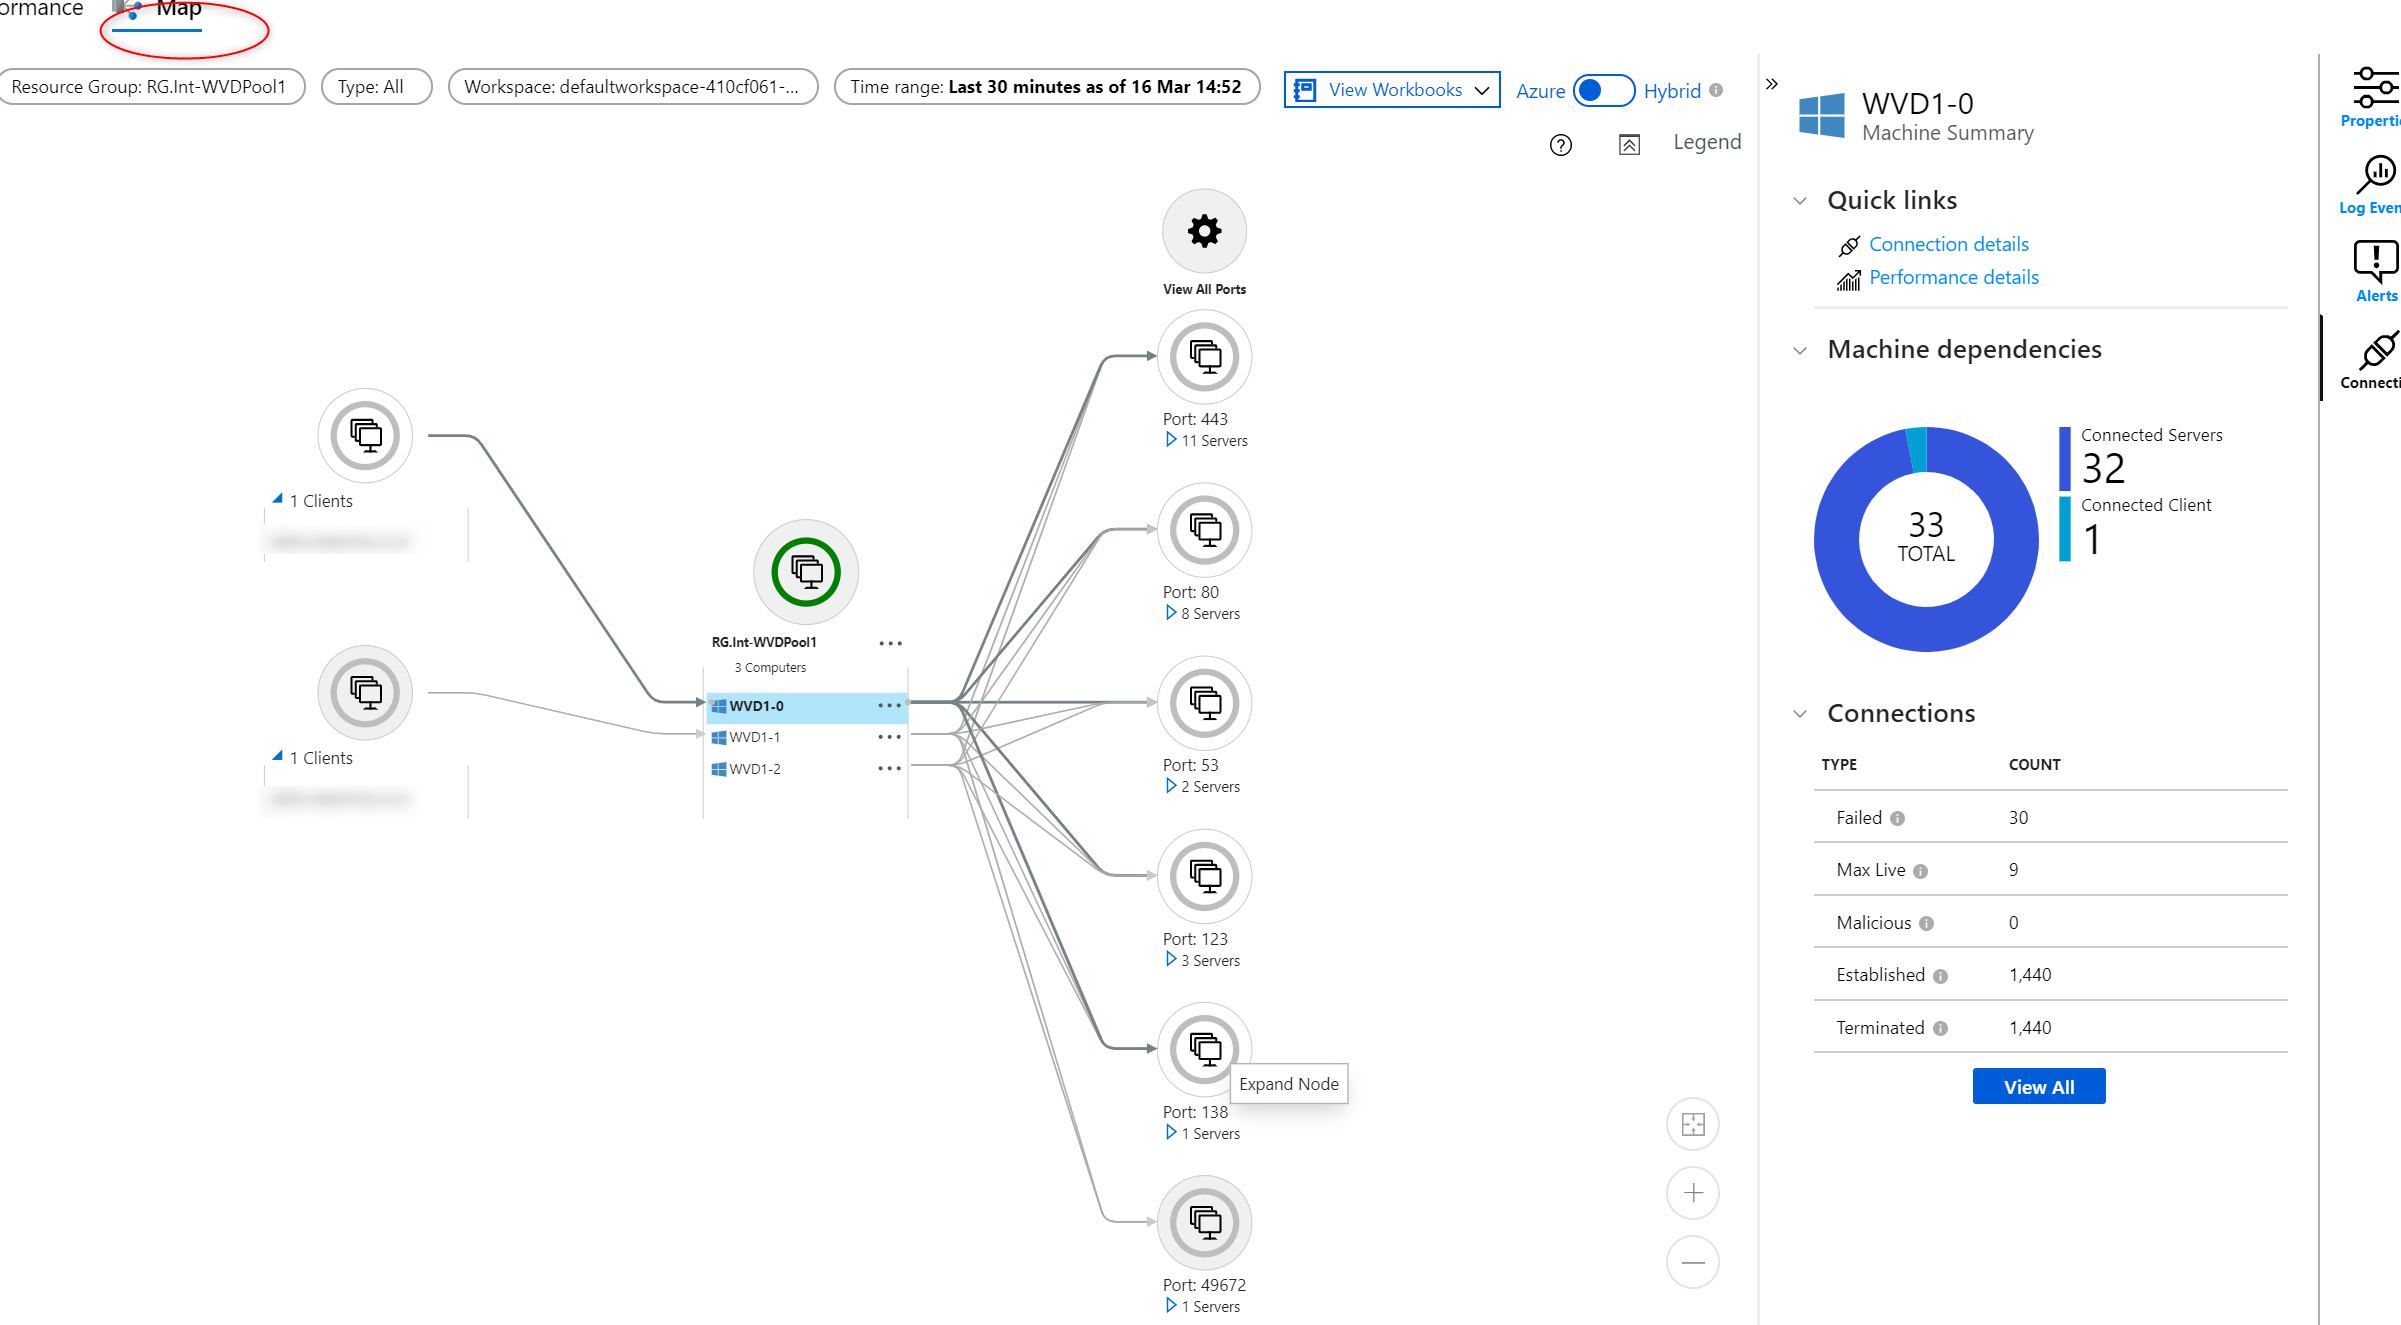
You can also switch to Map view and see a wireshark-like information:
Azure Log Analytics
First, you need to push your data to Log Analytics. Based on this docs we will use Set-RDSTenant with a bunch of parameters. Instead of clicking over the GUI, let’s get the necessary information through PowerShell:
#Log in with your Azure Tenant Admin or the account with permissions to RDS tenant
Add-RdsAccount -DeploymentUrl https://rdbroker.wvd.microsoft.com
$currentRDSTenant = Get-RDSTenant | out-gridview -passthru
#Log in with your Azure Tenant Admin or the account with permissions to Azure Log Analytics workspace
Connect-AzureRmAccount
#Select where your LA workspace is - Subscription, then resource group, then workspace
$Subscription = Get-AzureRmSubscription | Out-GridView -PassThru | Select-AzureRmSubscription

$resourceGroupName = Get-AzureRmResourceGroup | Out-GridView -PassThru
$workspace = Get-AzureRmResource -ResourceType 'Microsoft.OperationalInsights/workspaces' | Out-GridView -PassThru

$PrimarySharedKey = Get-AzureRmOperationalInsightsWorkspaceSharedKeys -ResourceGroupName $resourceGroupName.ResourceGroupName -Name $workspace.Name | Select-Object -ExpandProperty PrimarySharedKey
$WorkspaceID = Get-AzureRmOperationalInsightsWorkspace -ResourceGroupName $resourceGroupName.ResourceGroupName -Name $workspace.name | Select-Object -ExpandProperty CustomerId | Select-Object -ExpandProperty Guid

$RDSProperties= @{
 Name = $currentRDSTenant.TenantName
 AzureSubscriptionId = $Subscription.Id
 LogAnalyticsWorkspaceId = $WorkspaceID
 LogAnalyticsPrimaryKey = $PrimarySharedKey
}

#Finally configure tenant to send logs to Azure Log Analytics workspace
Set-RdsTenant @RDSProperties
Now we have set our WVD to push data to Log Anlytics Custom Log table.
KQL Queries
There are two sample queries (from the doc mentioned before) you can use to get all connected users and management actions performed on WVD.
This can also be a starting point for your own search queries:
See all connections
WVDActivityV1_CL
| where Type_s == "Connection"
| join kind=leftouter (
    WVDErrorV1_CL
    | summarize Errors = makelist(pack('Time', Time_t, 'Code', ErrorCode_s , 'CodeSymbolic', ErrorCodeSymbolic_s, 'Message', ErrorMessage_s, 'ReportedBy', ReportedBy_s , 'Internal', ErrorInternal_s )) by ActivityId_g
    ) on $left.Id_g  == $right.ActivityId_g
| join  kind=leftouter (
    WVDCheckpointV1_CL
    | summarize Checkpoints = makelist(pack('Time', Time_t, 'ReportedBy', ReportedBy_s, 'Name', Name_s, 'Parameters', Parameters_s) ) by ActivityId_g
    ) on $left.Id_g  == $right.ActivityId_g
|project-away ActivityId_g, ActivityId_g1
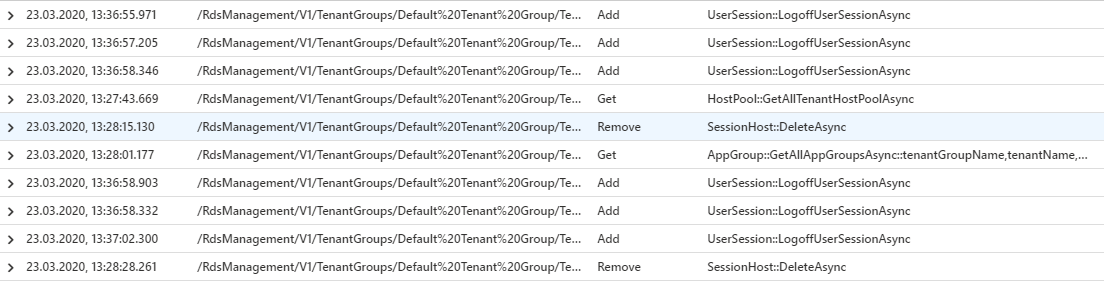
See all management actions
WVDActivityV1_CL
| where Type_s == "Management"
| join kind=leftouter (
    WVDErrorV1_CL
    | summarize Errors = makelist(pack('Time', Time_t, 'Code', ErrorCode_s , 'CodeSymbolic', ErrorCodeSymbolic_s, 'Message', ErrorMessage_s, 'ReportedBy', ReportedBy_s , 'Internal', ErrorInternal_s )) by ActivityId_g
    ) on $left.Id_g  == $right.ActivityId_g
| join  kind=leftouter (
    WVDCheckpointV1_CL
    | summarize Checkpoints = makelist(pack('Time', Time_t, 'ReportedBy', ReportedBy_s, 'Name', Name_s, 'Parameters', Parameters_s) ) by ActivityId_g
    ) on $left.Id_g  == $right.ActivityId_g
|project-away ActivityId_g, ActivityId_g1
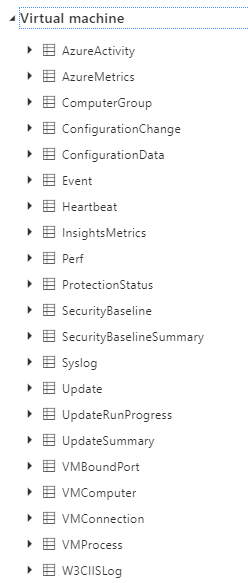
Azure VM counters
With KQL we can retrieve also VM Perf counters and.
Let’s narrow our KQL search to a specific Resource Group:
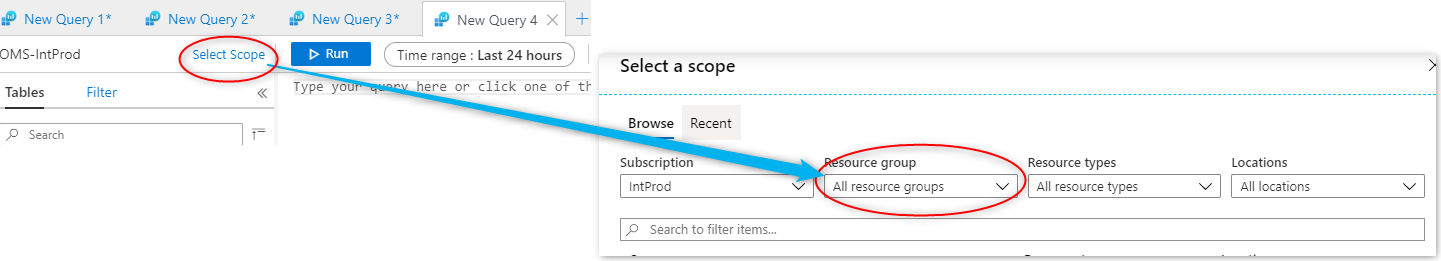
Here’s what you can use to build custom dashboards out of many VM counter goodies ![]()
SignIn Data
If you’ve enabled sending AzureAD Logs to Log Analytics, you can query SignInLogs to quickly see who uses WVD and how many times they logged in (in past 14 days):
SigninLogs
| where TimeGenerated > ago(14d)
| where AppDisplayName contains "Windows Virtual Desktop"
| summarize count() by Identity
| render table
Stop sending data
If you’d like to stop sending logs to Log Analytics, just use this:
$RDSProperties= @{
 Name = $currentRDSTenant.TenantName
 AzureSubscriptionId = $Subscription.Id
 LogAnalyticsWorkspaceId = $WorkspaceID
 LogAnalyticsPrimaryKey = $PrimarySharedKey
}

Set-RdsTenant @RDSProperties
Custom solutions
During the research, I’ve found one page that got my interest. Custom solution based on Azure Monitor provided by Sepago.
Definitely will have to look into this ![]()
Summary
Now, we have deployed WVD and set up basic monitoring.